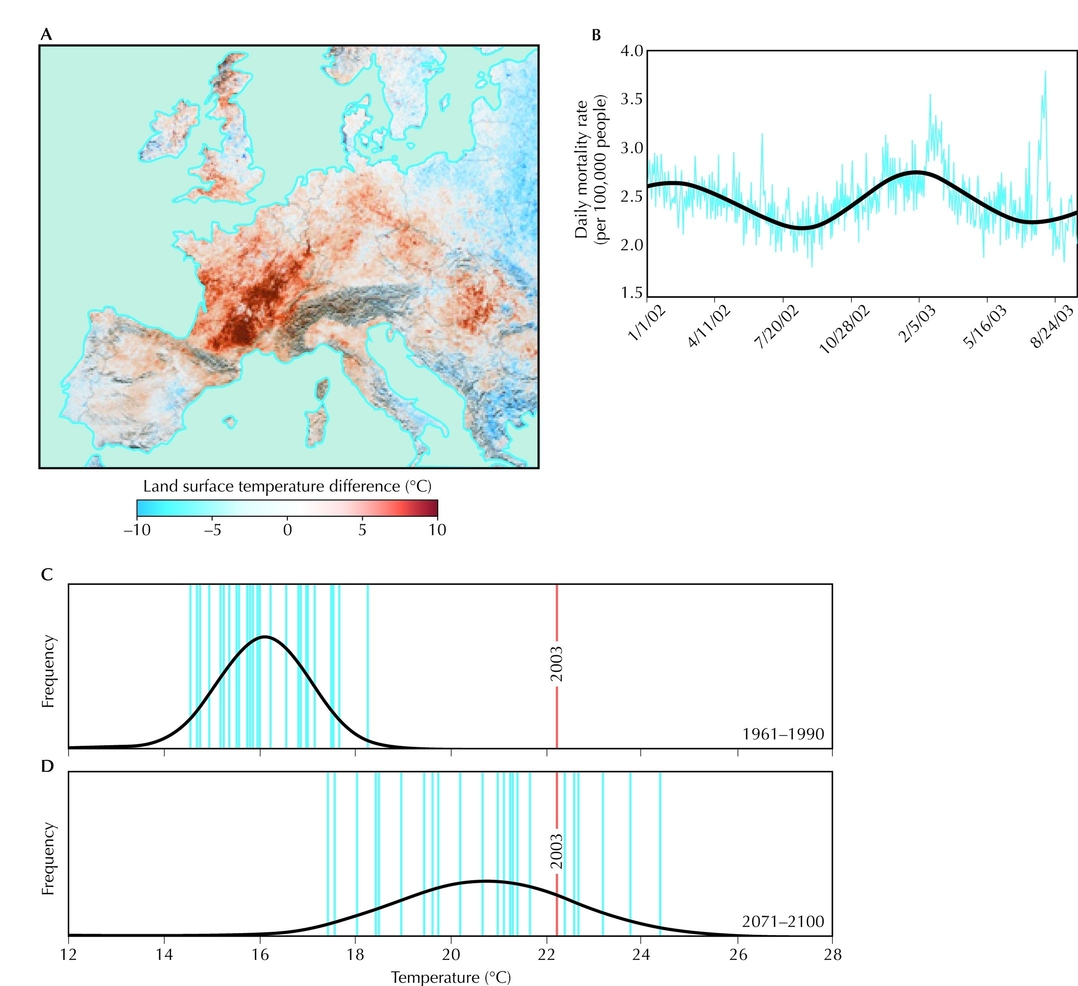
Figure 28.19. (A) Land surface temperatures for summer 2003, relative to summers 2000–2004. (B) Daily mortality rate in the German state of Baden-Wurttemberg; the red line shows the seasonal cycle, with higher mortality in winter. The graph shows the extra mortality due to an influenza outbreak in February–March 2003 and the sharp peak due to the heat wave of August 2003. That heat wave caused an additional 900–1300 deaths, out of 10.7 million people. (C) Distribution of summer temperatures in northern Switzerland, under a climate model representing conditions in 1961–1990. The exceptionally hot summer of 2003 is shown by a red bar. (D) The same, but for predicted conditions in 2071–2100, assuming current rates of increase in greenhouse gases. (A, Redrawn from Allen M.R. and Lord R. 2004. The blame game. Nature 432: 551–552. B, Redrawn from Box 1 figure in Schar C. and Jendritsky G. 2004. Hot news from summer 2003. Nature 432: 559–560. C, Modified from Fig. 3a,b in Schar C. et al. 2004. The role of increasing temperature variability in European summer heatwaves. Nature 427: 332–336.)
| © 2007-2010 by Cold Spring Harbor Laboratory Press. All rights reserved. |
| The reproduction, modification, storage in a retrieval system, or retransmission, in any form or by any means, electronic, mechanical, or otherwise, for reasons other than personal, noncommercial use is strictly prohibited without prior written permission. You are authorized to download one copy of the material on this Web site for personal, noncommercial use only. The material made available on this Web site is protected by United States copyright laws and is provided solely for the use of instructors in teaching their courses and assessing student learning. Dissemination or sale of any of this material, as a whole or in parts (including on the World Wide Web), is not permitted. All users of these materials and visitors to this Web site are expected to abide by these restrictions. Requests for permission for other uses of this material should be directed to Cold Spring Harbor Laboratory Press, 1 Bungtown Road, Cold Spring Harbor, NY 11724 or submitted via our World Wide Web Site at http://www.cshlpress.com/. |